


Audytor CH

Programa „Audytor CH“ skirta naujų šildymo sistemų automatizuotam grafiniam projektavimui, jau esamų įrengimų koregavimui (pvz., apšiltintuose pastatuose) bei vėdinimo sistemų (vamzdžių, kuriuose susidaro ledo tinklo) projektavimui. Svarbi programos funkcija yra galimybė į vieną projektą įdėti kelis šilumos arba vėdinimo šaltinius, todėl galima sukurti, pavyzdžiui, keturių vamzdžių sistemos projektą.
The results are in Lithuanian language in the C.H. 3.8 version.


New features in SET 7.4
In the newest version of program Audytor SET new functions and several enhancements have been implemented to speed up the installation design process.
Main changes:
- Surface systems - a ceiling system and a wall system
- Calculations of resulting cooling efficiency of the installation
| READ MORE |
Surface systems
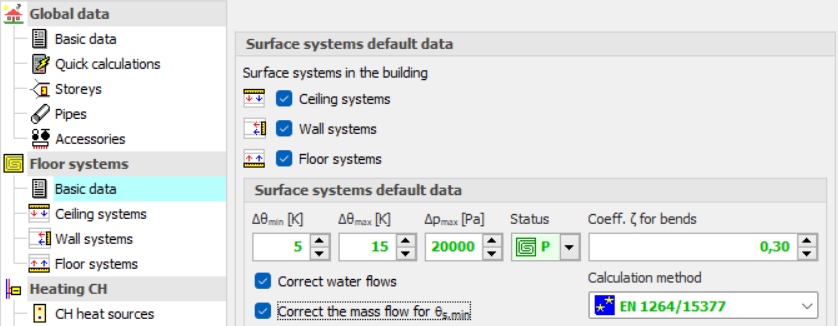
The Audytor SET 7.4 program introduced the possibility of designing surface systems - a ceiling system and a wall system. Among the surface systems, we also will find the well-known floor system
Before starting the design of the surface system, the user should declare the parameters related to the radiator's constrution. The constrution data will be automatically inherited directly into the drawning, significantly reducing the data entry time.
Calculations of the resulting cooling efficiency of the installation
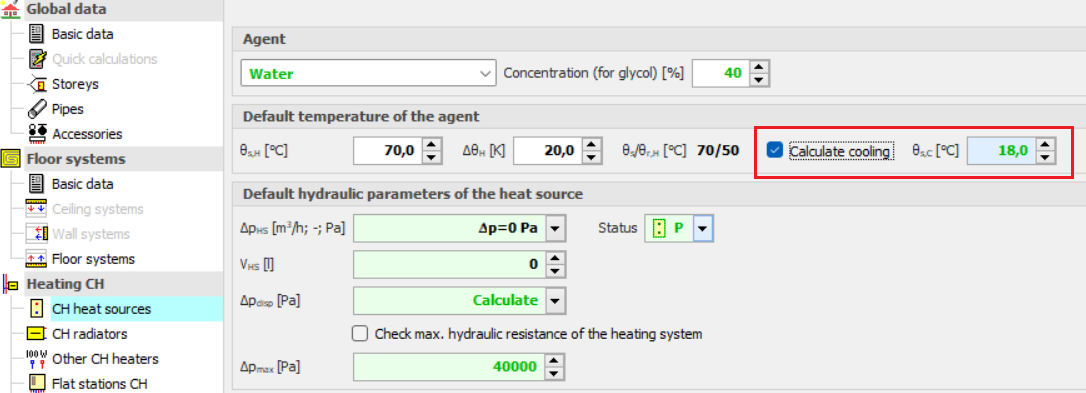
After designing the surface installation with heating parameters, the program will determine the resulting cooling power when switched to cooling mode.
These calculations will be performed if the CC module is activated in the general data and if in CH Heat Sorce Tab the Calculate Cooling option is enabled
The program uses the same flow rate of the agent in cooling mode as in the heating system. After performing the calculations, the results can be read both on the drawing – for example, on a tabular label attached to the manifold – and from the general tabular results.

Calculations of the resulting cooling efficiency of the installation
After designing the surface installation with heating parameters, the program will determine the resulting cooling power when switched to cooling mode.
These calculations will be performed if the CC module is activated in the general data and if in CH Heat Sorce Tab the Calculate Cooling option is enabled.
The program uses the same flow rate of the agent in cooling mode as in the heating system. After performing the calculations, the results can be read both on the drawing – for example, on a tabular label attached to the manifold – and from the general tabular results.
Audytor SET 7.3 - new possibilities!
The latest version of Auditor SET introduced new features and a number of improvements to speed up the installation design process.
The main changes are:
- New concept of work with SET program.
- New Fast Calculation (FC) module, which allows you to perform fast, approximate calculations of the thermal load of rooms and preliminary calculations of installations.
- Improvements in the design process of surface installations.
- Changed layout of the bill of materials.
- Changed module for viewing catalog data and selecting devices from catalogs.
- Improvements related to drawing wires.
- Improvements in graphics.
| HOW TO SWITCH TO 7.3 VERSION | GET MORE INFORMATION |
New concept of work with SET program
The new Fast Calculation (FC) module in the SET Auditor provides the opportunity for simplified installation design. It also makes it possible to speed up the creation of professional designs
In professional design mode, elements of simplified design can be used to streamline the design process (fast estimation of heat loss in the absence of results from the OZC program, selection of space heating concepts, etc.).
Both the simplified design and the detailed professional design are saved in the same file, which facilitates further work with the project.
Fast calculations of room thermal load
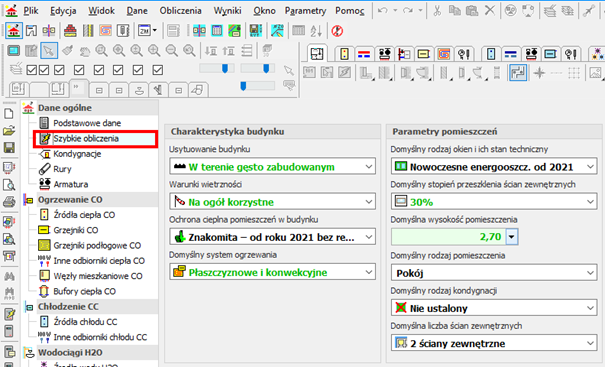
This function enables calculation of the value of room thermal load in a simplified manner based on a few basic parameters.
Thanks to this function, the designer can select the appropriate method of heating the room and get an idea of the type of heating equipment to be used in the room.
The surface layout suggested by the program can be inserted into the floor plan drawing.

Fast selection of elements without the need to draw the entire installation
When performing fast calculations, the program selects radiator power and duct diameters even if the heat source is not entered. From the default values declared in the general data, it inherits the parameters separately for the installation with radiators, separately for underfloor heating and places a virtual source in the resulting drawing.

Automatic generation of simplified connection routes
After selecting the manifold and individual receivers, the program generates simplified connections automatically.
Function of quick calculation of underfloor radiators
This function makes it possible to perform calculations for a group of underfloor radiators during the design process, before the complete calculation of the installation. Thanks to this, it is possible to quickly test the response of the calculation results to individual data (e.g. supply temperature, heating floor structure, diameter of the pipes, spacing of pipes, division into several circuits, etc.).
The function of quick selection of underfloor radiators allows to determine:
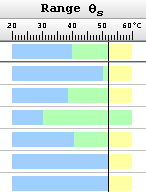
- possible supply temperature range for individual radiators
- maximum supply temperature for the indicated group of radiators
- proposed division of coils in order to meet the criteria of maximum hydraulic resistance and maximum length
- proposed division of coils in order to reduce the differences in resistance between coils and to facilitate hydraulic balancing of the installation.
Import of building bases in PDF format
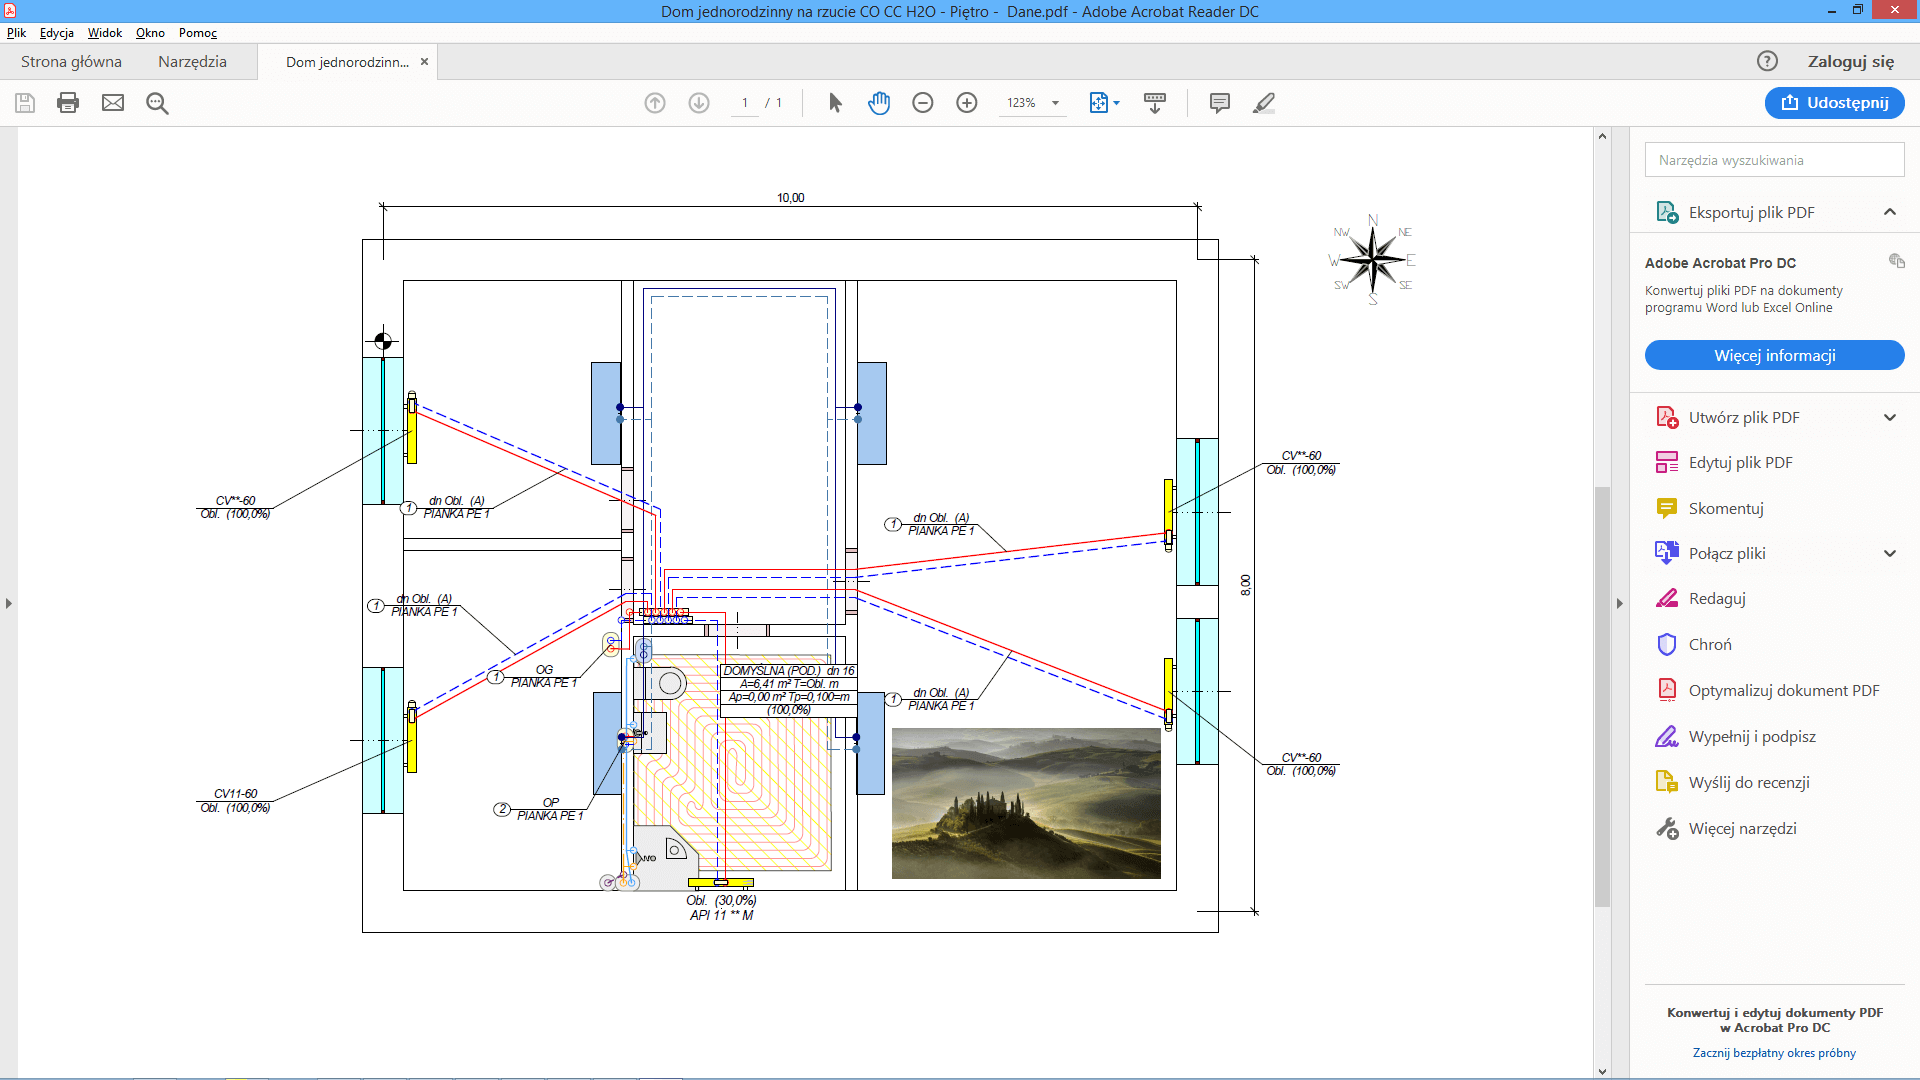
The Audytor program has long been able to import drawings in many popular formats. DWG and DXF formats are particularly suitable for technical drawings. However, in market practice, a large part of the documentation is provided in PDF files. Although it is a general format and not addressed to technical drawings, due to frequent use, the Audytor SET software has the option of importing drawings also in this format.

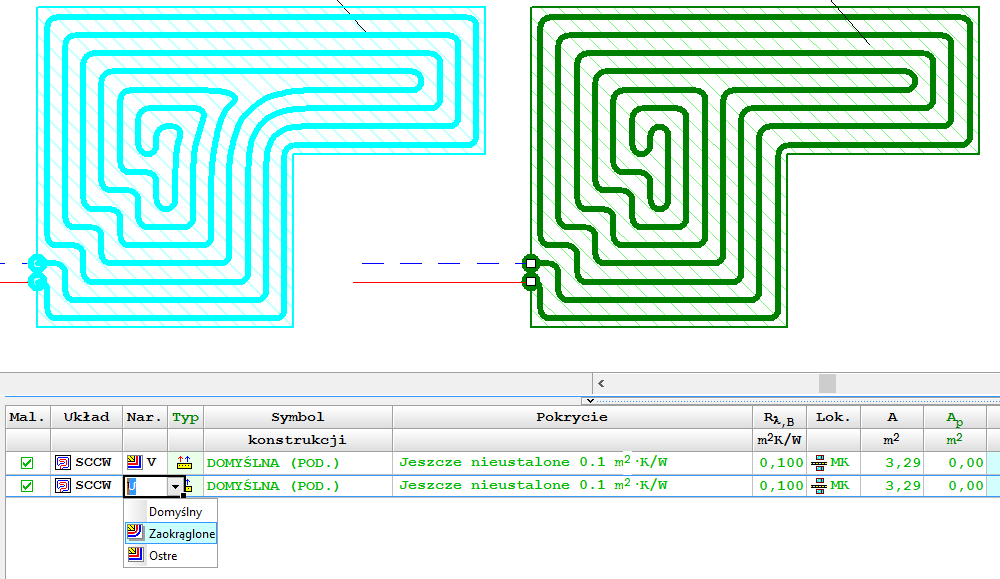
Drawing of underfloor heating coils
The program has expanded the possibilities of automatic drawing of floor heating coils. Currently, the user can choose one of the following ways to create a given coil:
- spiral with clockwise direction
- spiral with counter-clockwise direction
- meander coil.
Besides, the user can edit (correct) the coil shape created by the program.

New graphic design of the Audytor SET program
The graphic design has been changed in the program - both in terms of the graphic style and window organization. Thanks to this, they have become even more transparent
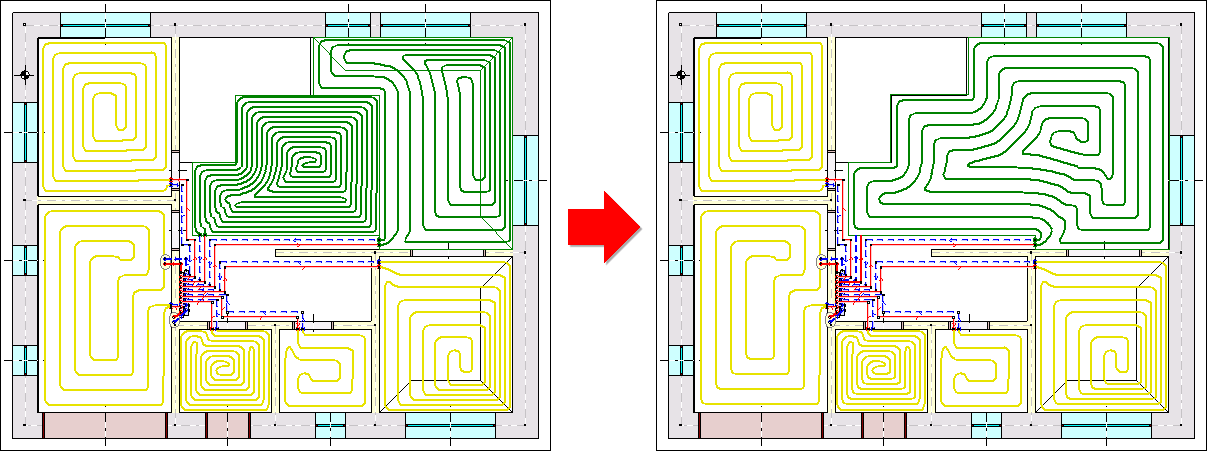
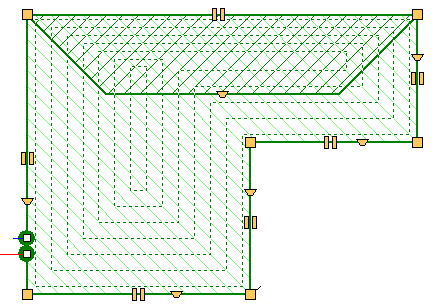
Mechanism for determining the effective heating surface of floor heaters
The automatic coil pipe generation mechanism has been extended with a function that allows determining the effective heating surface of a floor heater. The coil system can occupy the surface of the entire heater or "bypass" the manifold and connecting pipes of other heaters. It is also possible to designate zones to turn off part of the heating zone without having to change the shape of the heater itself.

Dividing and joining heating zones, rooms and polygons
Tools for quickly dividing and connecting polygons that define hotplates. One field can be divided into two or three equal fields - horizontally or vertically, respectively. The user can also indicate a dividing line using a broken line. At the same time, the option of combining several cooking zones into one has been introduced.
These functions are especially useful when designing underfloor heating, but can be used for sharing
and joining other polygons (e.g. room zones).

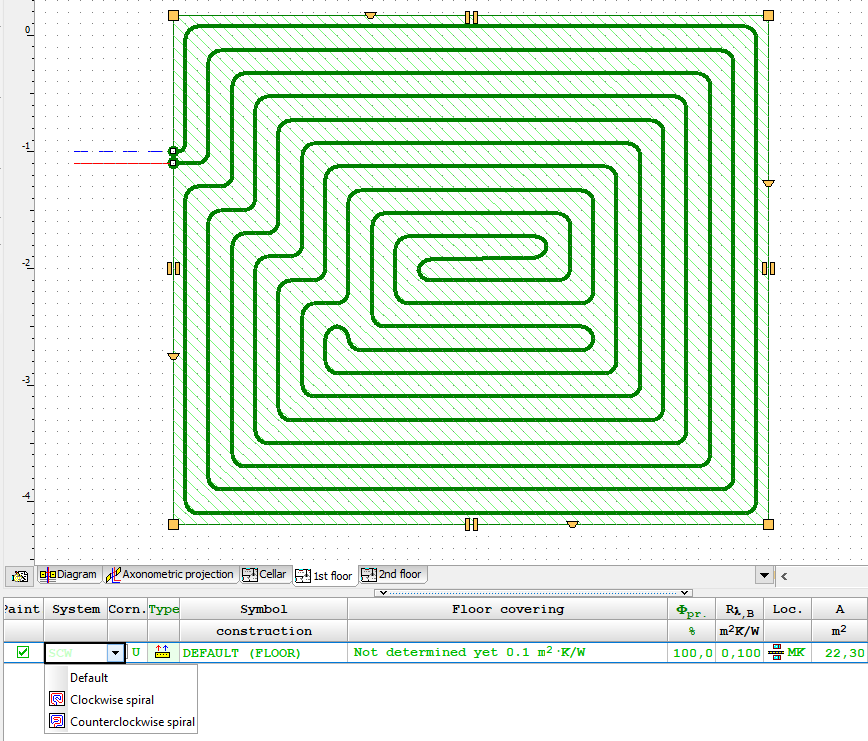
Selection of coil drawing direction
The program allows you to choose the direction of drawing the spiral coil clockwise or counterclockwise.
Choice of pipe laying method in concave corners
Depending on the shape of the room and the assumed coil pipe laying system, it is possible to impose a way of drawing pipes "bypassing" concave corners.
Auxiliary lines for manual drawing of the coil
If the automatic coil generated option is switched off, the program displays auxiliary lines supporting manual drawing of lines. The lines are drawn with a given spacing taking into account the spacing in the peripheral zone.
Insert a heating zone around the cursor
The function of automatic insertion of a heating zone in the room zone (so-called insertion around the cursor).
Showing unconnected heating zones
The heating zones before connecting to the pipes are displayed in less intense colors, thanks to which it is very easy to know which fields still need to be connected.

Extending the range of mixing group schemes
Extended range of mixing group schemes with the possibility of local mixing at the manifold.
Drawing in drawing
It is possible to insert a fragment of another drawing in the drawing. This significantly increases the possibility of creating clear technical documentation.
Inserting a fragment of a DWG drawing
The ability to easily use one DWG file containing architectural plans of many floors.
The user can indicate which parts of the DWG file are to be used on each floor and then adjust their position using precision panning tools.
Coloring the walls
Display of walls with filling - gray for external walls and yellow for internal walls. This improves the readability of created drawings.

Selection in color
When selecting objects using the window, the selection window is filled with blue, which improves its readability.
Readability of selected objects has also been increased by displaying them with all details in green.
Selective selection
The selective selection function allows you to indicate what elements of the drawings are to be marked (e.g. rooms, pipes, fittings, etc.).
This function is useful when, for example, the user would like to duplicate selected elements from the indicated area to the next floor.
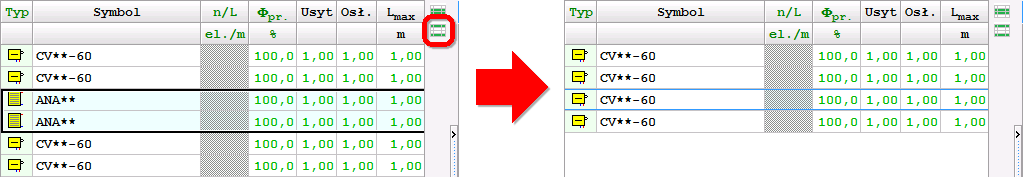
Narrow the range of selected objects in the tables
The functions Leave selected lines and Leave unselected lines allow you to narrow the range of selected objects. After selecting a number of elements in the drawing window, you can then remove from the selection the items indicated in the table or just leave those items.

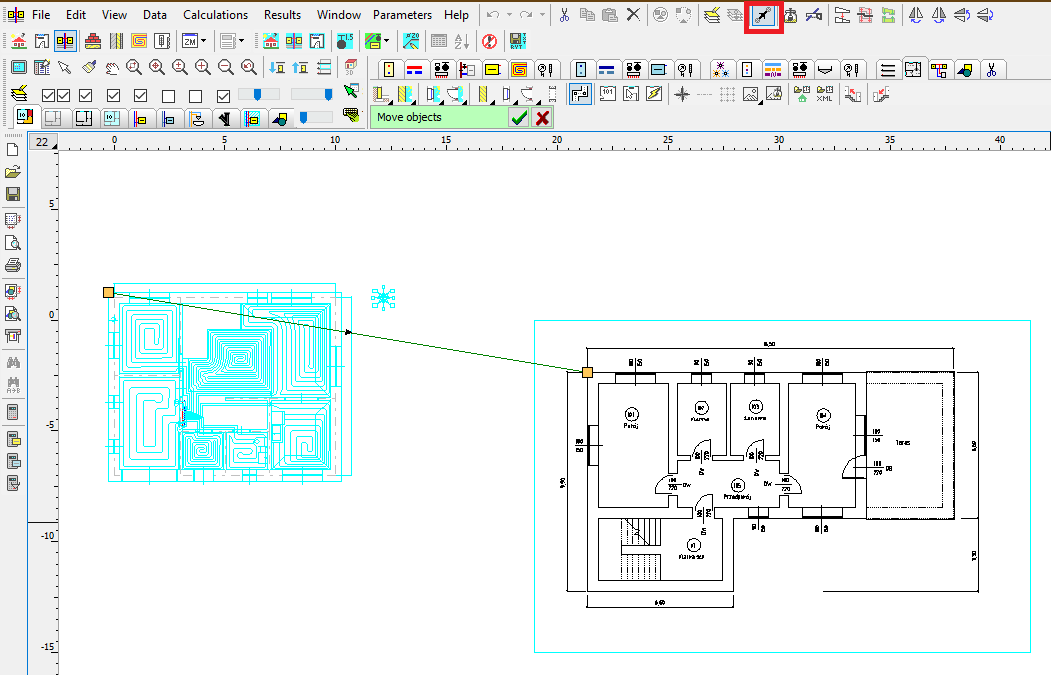
Precise moving of objects
This function enables precise moving of objects. The user defines the displacement vector, i.e. specifies the start and end points.
This function, combined with the Magnifier tool, enables very precise moving of objects. It is very useful, in the case of matching architectural objects on different floors. Just enable the display of the previous floor and then indicate the corresponding points on the architectural plans of two floors.
Improved critical flow display
When you turn on critical flow display, the other elements of the drawings are displayed less intensively. This makes it even easier to orient yourself in the course of critical circulation.
Drawing adjacent floors
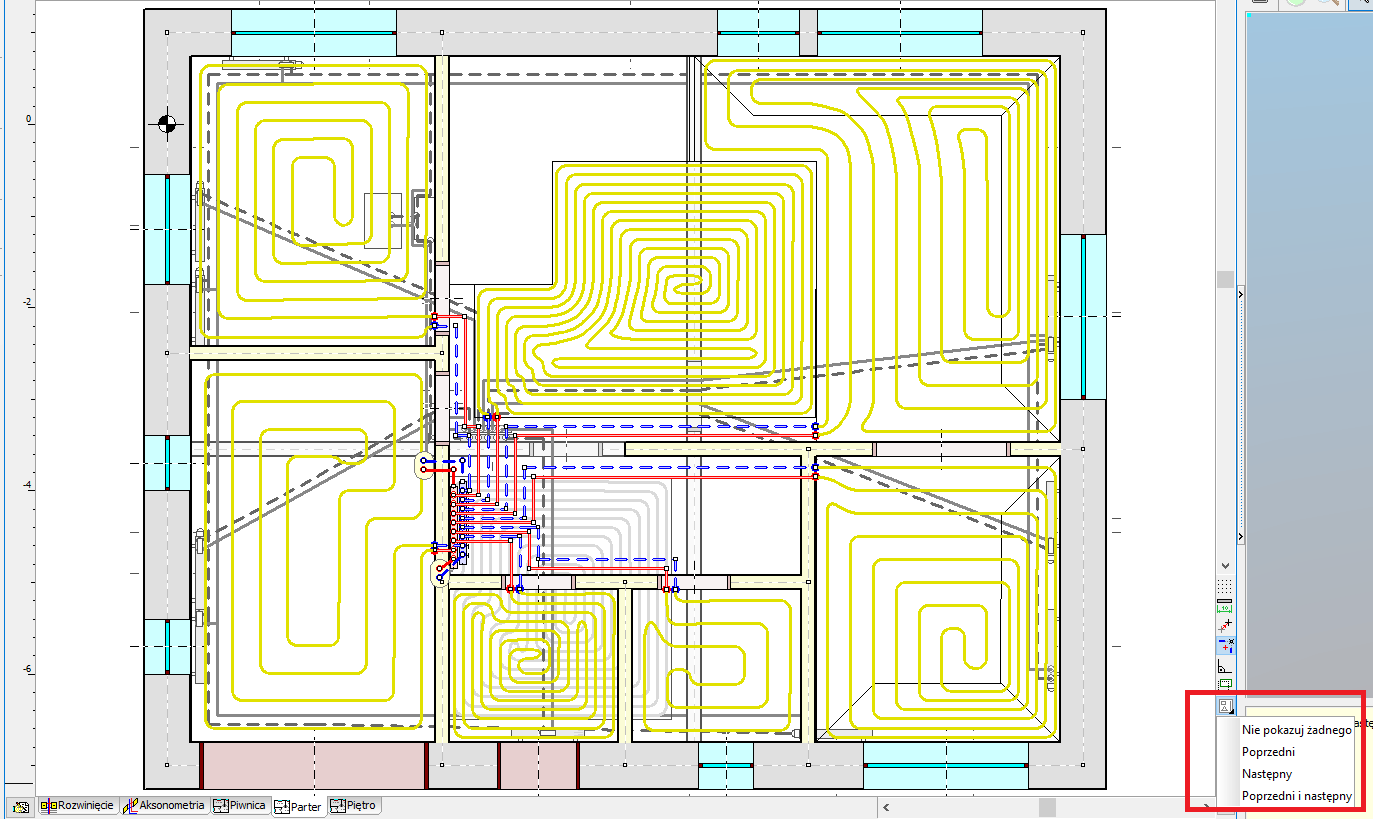
Expanding the possibilities of displaying (drawing) the previous floor.
Currently, elements of the previous storey or the next storey can be displayed, or both. This facilitates adjusting architectural projection positions and location of installation risers.
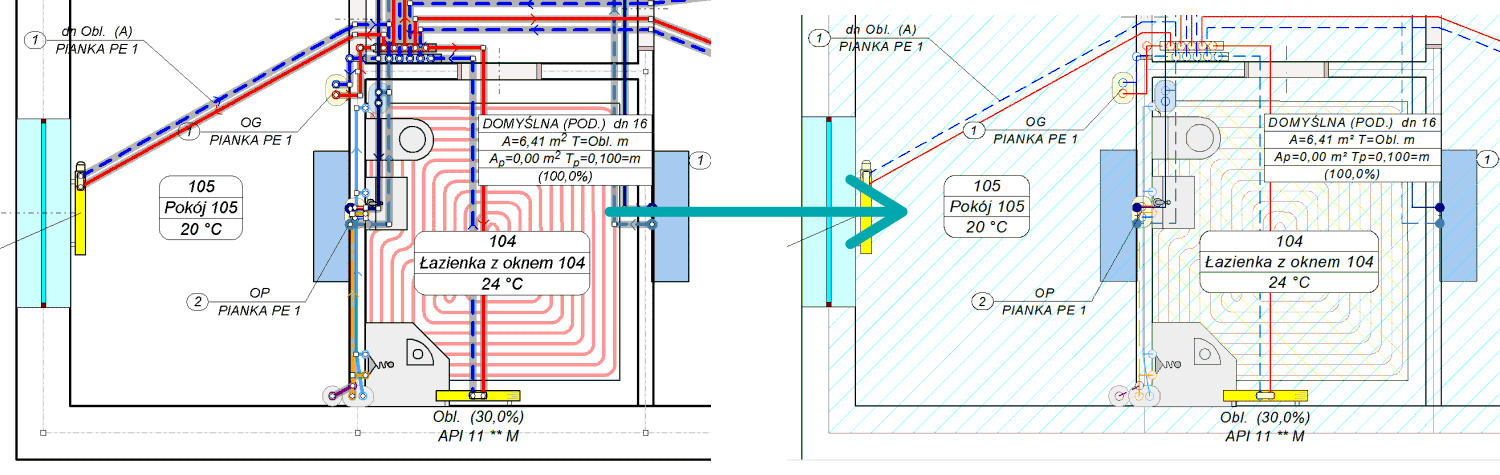
Temporarily turn off of the label display
The option of temporarily turning off the display of labels during design, improves the readability of drawings on the screen in situations where labels are not necessary.

Adjusting wall thickness
This option allows you to change the thickness of the walls when drawing them:
– CTRL + left square bracket - reducing the wall thickness,
– CTRL + right square bracket - increasing wall thickness.
The same effect can be achieved by pressing the CTRL key while holding the mouse wheel. This function allows easy adjustment of the wall thickness to the loaded building foundation (planview).

Export extension to Excel
The ability to export to Microsoft Excel not only individual tables, but also all tables and diagnostics at once. This significantly reduces exporting time if you need to save a number of tables.
Import and export of drawings in DWG format
The program has been equipped with the latest cooperation module with DWG and DXF files.
It allows among others:
- Loading DXF and DWG drawings in the newest versions.
- UNICODE text support for most characters to be displayed correctly.
- Export of drawings in the following formats: DWG, DXF, PDF, SVG, CGM, HPHL, SWF.
- Significantly faster display of complex drawings thanks to the simplified paint function.
- A more realistic export of drawings to DXF and DWG files.
- Saving raster drawings in DXF and DWG files.
- More convenient management of drawing layers
Import of building bases from Autodesk® Revit®
The function allows to create layout of corresponding to the levels on which rooms have been defined in Autodesk® Revit®. The transfer of data takes place via a file generated in Autodesk® Revit® using the Audytor gbXML plugin.

Export of the installation project to Autodesk® Revit®
The function allows you to export the installation project to a file that can later be loaded into Autodesk® Revit® using the Audytor SET plugin for Revit.
The function allows you to export from the data and export from the results. Export from data allows you to save even an incomplete installation project (not recalculating), for example, the arrangement of the water risers, or the layout of the radiators. Export from results allows us to use technical data of selected pipes and devices in Autodesk® Revit®, eg pipe diameters, valve settings, radiator sizes, and pipe spacing in underfloor heating. In addition, physical quantities are available, such as the medium speed, the power of the radiator, and pressure losses.

| 7.2 Pro | 7.2 Basic | 7.1 Pro | 7.1 Basic | 6.0 Pro | 6.0 Basic | 4.1 | 4.0 | 365 Pro | 365 Basic | |
|---|---|---|---|---|---|---|---|---|---|---|
| Calculations of the resulting cooling efficiency of the installation |

|
|
||||||||
| Calculations of the resulting cooling efficiency of the installation |
|
|
||||||||
| New concept of work with SET program |
|
|
||||||||
| Fast calculations of room thermal load |
|
|
||||||||
| Fast selection of elements without the need to draw the entire installation |
|
|
||||||||
| Automatic generation of simplified connection routes |
|
|
||||||||
| Function of quick calculation of underfloor radiators |
|
|
|
|
||||||
| Import of building bases in PDF format |
|
|
|
|
||||||
| Drawing of underfloor heating coils |
|
|
|
|
||||||
| New graphic design of the Audytor SET program |
|
|
|
|
||||||
| Mechanism for determining the effective heating surface of floor heaters |
|
|
|
|
||||||
| Dividing and joining heating zones, rooms and polygons |
|
|
|
|
||||||
| Selection of coil drawing direction |
|
|
|
|
||||||
| Choice of pipe laying method in concave corners |
|
|
|
|
||||||
| Auxiliary lines for manual drawing of the coil |
|
|
|
|
||||||
| Insert a heating zone around the cursor |
|
|
|
|
||||||
| Showing unconnected heating zones |
|
|
|
|
||||||
| Extending the range of mixing group schemes |
|
|
|
|
||||||
| Drawing in drawing |
|
|
|
|
||||||
| Inserting a fragment of a DWG drawing |
|
|
|
|
||||||
| Coloring the walls |
|
|
|
|
||||||
| Selection in color |
|
|
|
|
||||||
| Selective selection |
|
|
|
|
||||||
| Narrow the range of selected objects in the tables |
|
|
|
|
||||||
| Precise moving of objects |
|
|
|
|
||||||
| Improved critical flow display |
|
|
|
|
||||||
| Drawing adjacent floors |
|
|
|
|
||||||
| Temporarily turn off of the label display |
|
|
|
|
||||||
| Adjusting wall thickness |
|
|
|
|
||||||
| Export extension to Excel |
|
|
|
|
||||||
| Display of system pipes with actual diameters |
|
|
|
|
|
|
||||
| Intelligent duplication of system components - "down". |
|
|
|
|
|
|
||||
| A system of editable keyboard shortcuts |
|
|
|
|
|
|
||||
| The function of organizing labels on several floors at the same time |
|
|
|
|
|
|
||||
| Import and export of drawings in DWG format |
|
|
|
|
|
|
||||
| Import of building bases from Autodesk® Revit® |
|
|
|
|
||||||
| Export of the installation project to Autodesk® Revit® |
|
|
|
|
||||||
| The ability to check the correctness of the floors layout |
|
|
|
|
|
|
|
|
||
| Creating a list of fittings |
|
|
|
|
|
|
|
|
|
|
| Adjustment of existing installations |
|
|
|
|
|
|
|
|
|
|
| Designing new installations |
|
|
|
|
|
|
|
|
|
|
| Designing a traditional two-pipe installation |
|
|
|
|
|
|
|
|
|
|
| Desiging on plan views |
|
|
|
|
|
|
|
|
|
|
| Desiging on diagrams |
|
|
|
|
|
|
|
|
|
|
| Loading of building bases with the results of heat load from the Audytor HL program |
|
|
|
|
|
|
|
|
|
|
| Loading the list of rooms with the results of the heat load from the Audytor HL software |
|
|
|
|
|
|
|
|
|
|
| The ability to draw building bases (walls, windows and doors) |
|
|
|
|
|
|
|
|
|
|
| Automatic creation of diagrams of risers based on plan views |
|
|
|
|
|
|
|
|
|
|
| Visualization of critical circuits |
|
|
|
|
|
|
|
|
|
|
| Auxiliary lines indicating characteristic points |
|
|
|
|
|
|
|
|
|
|
| Drawing lines in pairs (supply - return) |
|
|
|
|
|
|
|
|
|
|
| Drawing lines with a continuous broken line |
|
|
|
|
|
|
|
|
|
|
| Automatic inserting of radiators under the windows |
|
|
|
|
|
|
|
|
|
|
| Automatic connection of radiators to distribution pipes |
|
|
|
|
|
|
|
|
|
|
| Bonding and scaling drawings |
|
|
|
|
|
|
|
|
|
|
| Grafinis redaktorius |
|
|
|
|
|
|
|
|
|
|
| Duplicating fragments of drawings within a storey and to the next storeys |
|
|
|
|
|
|
|
|
|
|
| Numatytųjų duomenų paveldėjimas |
|
|
|
|
|
|
|
|
|
|
| Creating mirror images of parts of drawings |
|
|
|
|
|
|
|
|
|
|
| Working in a shared environment Audytor SET |
|
|
|
|
|
|
||||
| Ready-made blocks of typical parts of the installation |
|
|
|
|
|
|
|
|
|
|
| Backup system of data files |
|
|
|
|
|
|
||||
| Ability to create your own blocks |
|
|
|
|
|
|
|
|
|
|
| Extensive directory database |
|
|
|
|
|
|
|
|
|
|
| Extended editing functions in tables |
|
|
|
|
|
|
|
|
|
|
| "Find and Replace" function in tables |
|
|
|
|
|
|
|
|
|
|
| Grindinių radiatorių projektavimas |
|
|
|
|
|
|
|
|
|
|
| Automatic drawing of the underfloor heating coil |
|
|
|
|
|
|
|
|
||
| Diagnostinė duomenų sistema |
|
|
|
|
|
|
|
|
|
|
| Three-dimensional visualization of the installation |
|
|
|
|
|
|
|
|
||
| Extended error diagnostics |
|
|
|
|
|
|
|
|
|
|
| Automatic axonometry of the installation |
|
|
|
|
|
|
||||
| Defining default data for all kinds of devices |
|
|
|
|
|
|
|
|
|
|
| Catalog photos of selected devices in the hints in the table |
|
|
|
|
|
|
|
|
|
|
| The function of organizing zones of risers on the diagrams |
|
|
|
|
|
|
||||
| Considering the heat gains from connections to underfloor radiators as a radiator power |
|
|
|
|
|
|
|
|
|
|
| Selection of pipe diameters in the installation |
|
|
|
|
|
|
|
|
|
|
| Selecting radiators (catalog 55 thousand) |
|
|
|
|
|
|
|
|
|
|
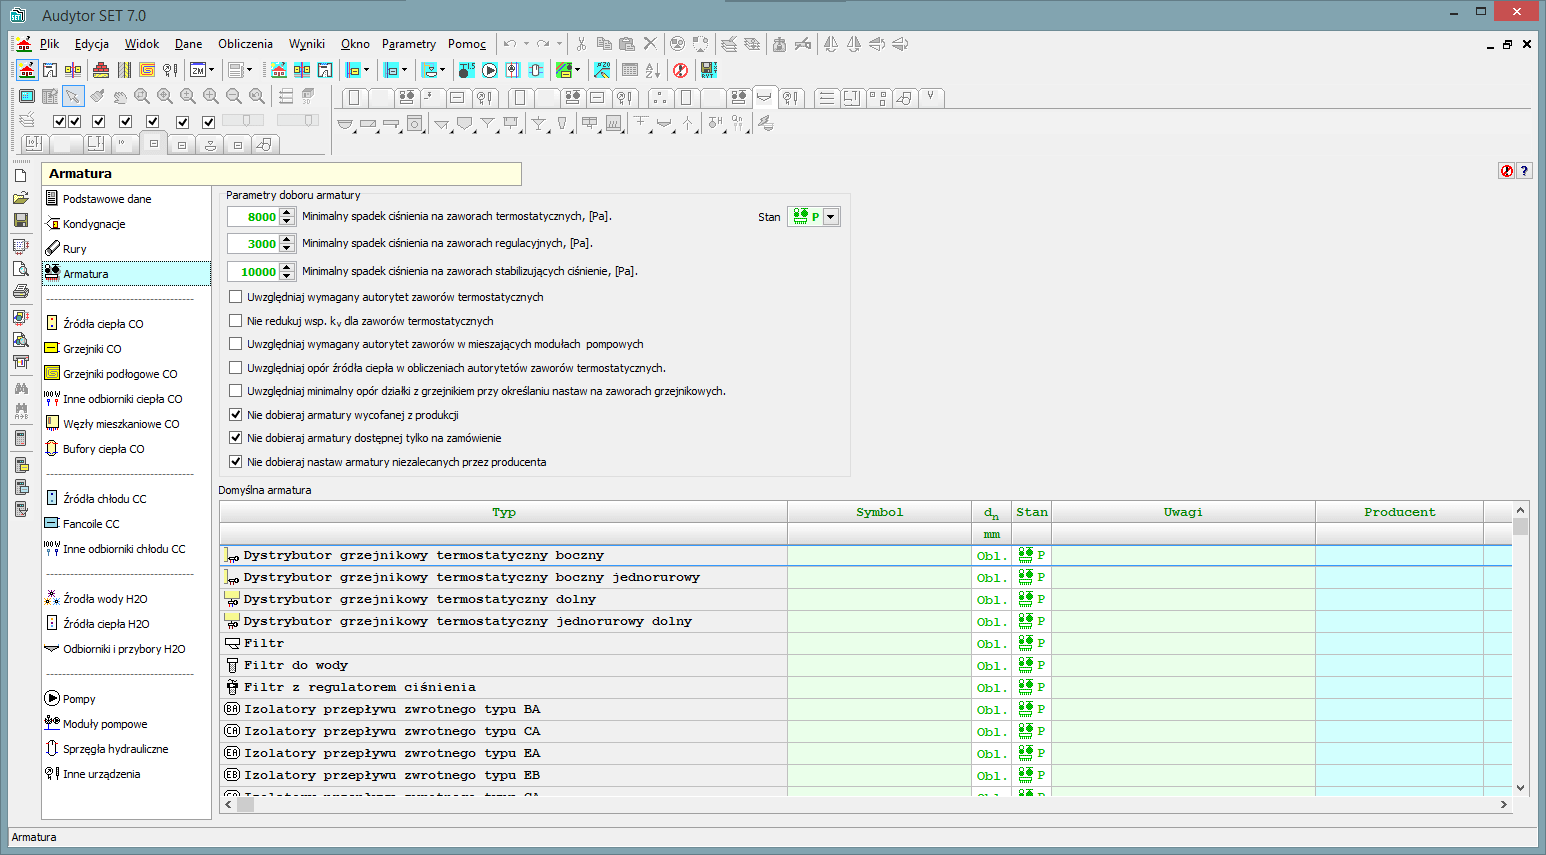
| Selecting fittings |
|
|
|
|
|
|
|
|
|
|
| Provides total pressure losses in the system |
|
|
|
|
|
|
|
|
|
|
| Reduces excess of pressure in the circuits through the selection of presets on the valves or flanges selection of the throttle bores. |
|
|
|
|
|
|
|
|
|
|
| Adjusts presets of the pressure and flow rate governors |
|
|
|
|
|
|
|
|
|
|
| Takes into account the requirements regarding the authorities of thermostatic valves |
|
|
|
|
|
|
|
|
|
|
| Selects group of pumps |
|
|
|
|
|
|
|
|
|
|
| Selects pumps |
|
|
|
|
|
|
|
|
|
|
| Allows the use of dual manifolds |
|
|
|
|
|
|
|
|
|
|
New program features
- Possibility to import building bases from Autodesk® Revit® via a gbXML file,
- Possibility to export data about the designed installation to Autodesk® Revit®..
Graphic editor
A drawing with marked room zones is necessary to create a project. They can be drawn manually in the program or loaded together with bases from the HL program. If a three-dimensional model of a building has been created in the HL program, the drawings with the results will be loaded into the program. The building entered in tabular form will be loaded as a list of rooms with the results.
The most comfortable mode of operation allows you to take full advantage of the possibilities of cooperation with the HL program:
- Uploading building bases to the HL program from files such as DWG, DXF, WMF, JPG.
- Drawing a building model in the HL program and making thermal calculations.
- Loading the results from the HL program in the system design program (heat load values and floor plans)
- Drawing the installation and making calculations.
Designing an installation can be carried out only on a diagram, only on plan views, or partially on plan views and partially on a diagrams. It is also possible to combine fragments of installations drawn on plan views with elements drawn on diagrams.
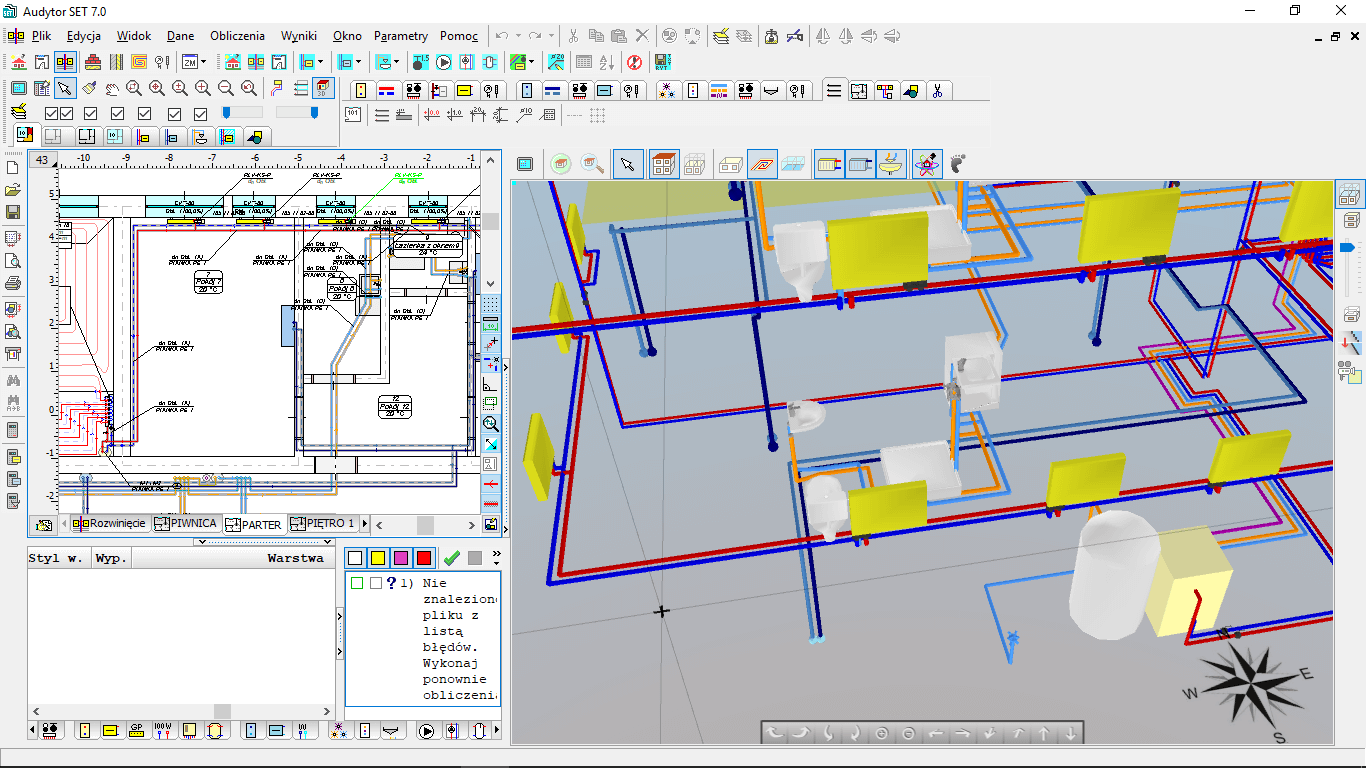
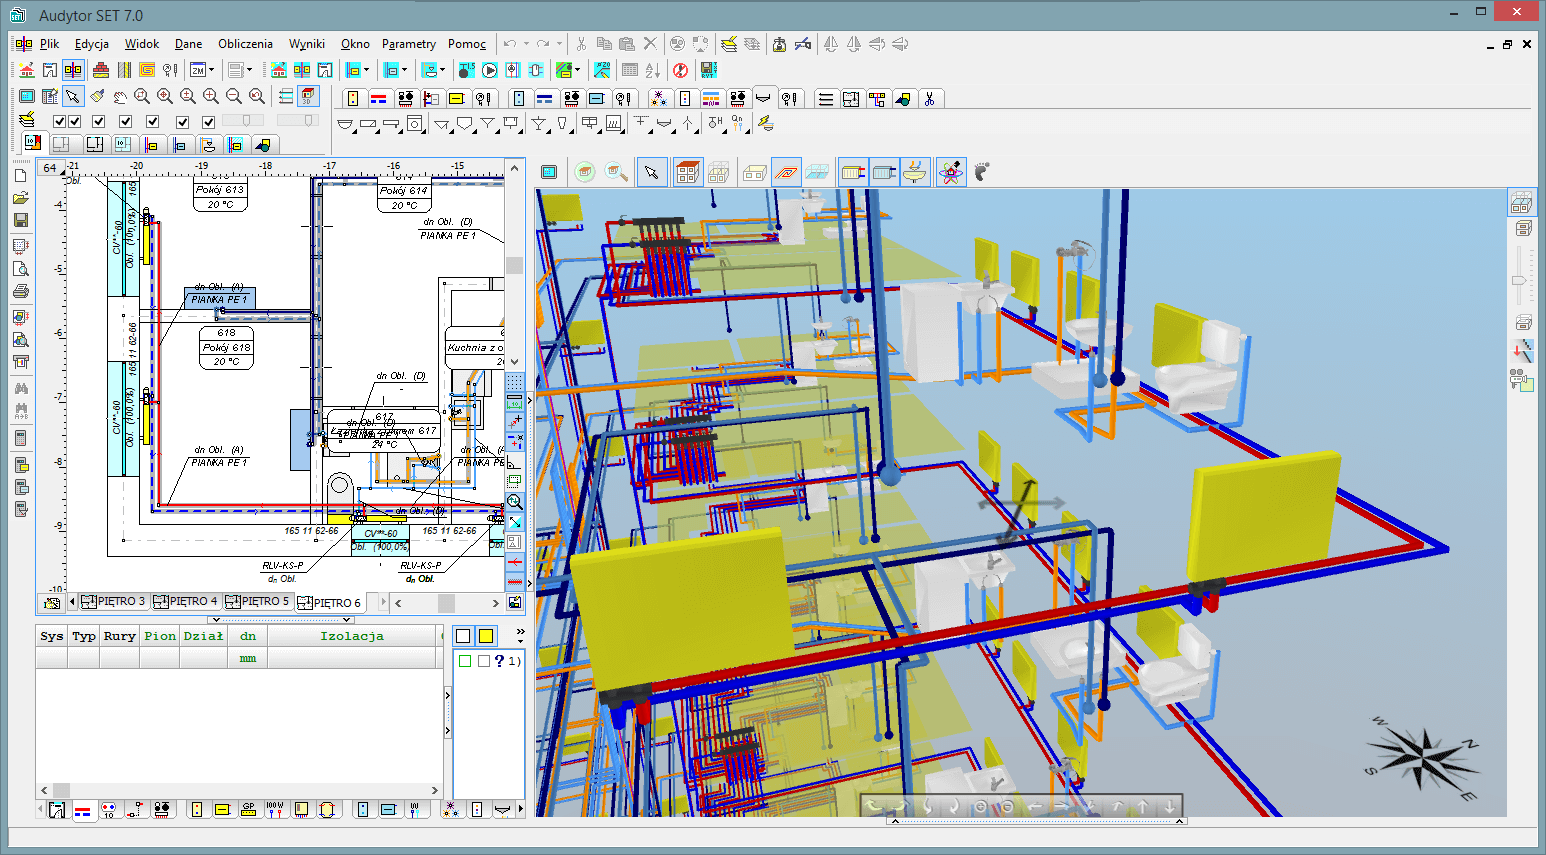
In the case of drawing onplan views, the program automatically creates a simple diagram of risers, "fastening" individual projections. The program Audytor SET has been equipped with a three-dimensional visualization module of the installation, analogous to the building visualization module, available in the Audytor HL program.
Default data inheritance system
A significant part of the parameters introduced at the beginning of defining the building are typical data for the entire building (the so-called default data). When entering general data, the user can define for each device default catalog symbol. This symbol is automatically assigned to each device in the drawing. The previously defined default catalog symbol can be changed at any time, also after inserting the device into the drawing. Changing the symbol of a device in the general data will change the symbols of all devices of a given type, unless the symbol has been “firmly” entered for a given device.
The data is edited in the table, which allows you to specify parameters for many drawing elements simultaneously. Linking the drawing to the table makes the element edited in the table highlighted in the diagram.
The data inheritance system allows you to:
- significant time savings at the data entry stage (without the need to repeatedly enter repeated data),
- very quick change of data in case of a change in design assumptions or creating variant projects.
New program features Audytor
- Import and export of drawings in DWG format
- The function of organizing the zones of risers in the development
- Data file backup system
- A mechanism that automatically generates an axonometric scheme of the designed installation
- Ability to display installation pipes with actual diameters
- Mechanism of intelligent duplication of installation elements
- The function of arranging labels on several storeys at the same time (in plan views and axonometry drawings) and a mechanism for duplicating labels on adjacent storeys
- Improving the drawing of sewage installations.
- A system of keyboard shortcuts to assign simple button combinations to the most used drawing tools.
- Improvements in editing drawing layer properties.
- Improvements in displaying information about the circulation by a given heater / receiver.
Programos charakteristikos
Naudojant programą galima atlikti išsamius sistemos skaičiavimus, pagal kuriuos:
-
parenkami vamzdžių skersmenys;
-
nustatoma atskirų grandinių hidraulinė varža, atsižvelgiant į gravitacinį slėgį, kurį sukelia vamzdžiuose esančio vandens vėsinimas ir šilumos imtuvai;
-
apskaičiuojami bendrieji sistemos slėgio nuostoliai;
-
pasirinkus vožtuvų arba droselio kanalo jungių išankstinio įjungimo mechanizmus, sumažinamas perteklinis slėgis grandinėse. Tokiu atveju atsižvelgiama į poreikį užtikrinti tinkamą vamzdžių nuotolio hidraulinę varžą;
-
pasirenkami išankstiniai diferencinio slėgio valdiklių, įrengtų projektuotojo pasirinktose vietose, nustatymai (statvamzdžio pagrindas, sistemos šaka ir t. t.);
-
automatiškai atsižvelgiama į institucijų termostatiniams vožtuvams keliamus reikalavimus (tinkamą slėgio kritimą juose);
-
pasirenkama buto valdymo sistema (3.8 versija);
-
parenkamos buferių sistemos, suderinamos su buto valdymo sistemomis (3.8 versija);
-
parenkama siurblių grupė;
-
parenkami siurbliai;
-
sudaromos sąlygos naudoti hidraulines movas;
-
sudaromos sąlygos naudoti dvigubus vamzdynus.
Naudojant programą, galima atlikti šiluminius skaičiavimus, pagal kuriuos:
-
nustatomas šilumos iš vamzdžių padidėjimas;
-
apskaičiuojamas šilumnešio vėsinimas vamzdžiuose;
-
nurodytai šilumos apkrovai parenkami reikiamo dydžio radiatoriai;
-
atsižvelgiant į vėsinimą vamzdžiuose ir šilumos padidėjimą iš vamzdžių, parenkamas tinkamas šilumnešio srautas (esamų instaliacijos reglamentų variantas, pvz., apšiltintiems pastatams);
-
atsižvelgiama į vandens, esančio vamzdžiuose, vėsinimo poveikį gravitacinio slėgio vertei ir šilumos imtuvų šiluminei išeigai;
-
apskaičiuojami suprojektuotų grindinių radiatorių parametrai.
Naudojant programą, galima suprojektuoti šias sistemas:
-
siurblio sistemą;
-
vamzdžių išdėstymo: vieno vamzdžio, dviejų vamzdžių, keturių vamzdžių arba mišrus;
-
šilumnešio arba aušalo: vandens, etileno glikolio arba propileno glikolio;
-
viršutinio paskirstymo, apatinio paskirstymo, horizontalių sistemų, vamzdynų sistemų;
-
konvekcinių radiatorių, grindinių radiatorių, sieninių radiatorių;
-
automatinių oro alsuoklio vožtuvų (sistema be tinklo nutekėjimo);
-
termostatinių arba mechaninių radiatorių vožtuvų;
-
pradinio sistemos balansavimo naudojant vožtuvus su išankstinio įjungimo mechanizmu arba jungėmis;
-
diferencinio slėgio stabilizavimo naudojant diferencinio slėgio valdiklius;
-
galimybė taikyti srauto valdiklius.
Katalogų duomenų bazėje pateikiama informacija apie vamzdžius, vožtuvus ir šildytuvus. Viename projekte vienu metu gali būti naudojami skirtingų bendrovių montavimo elementai, vamzdžiai ir radiatoriai. Programa leidžia projektuoti labai dideles sistemas (maždaug iki 140 statvamzdžių ir 12 000 radiatorių).
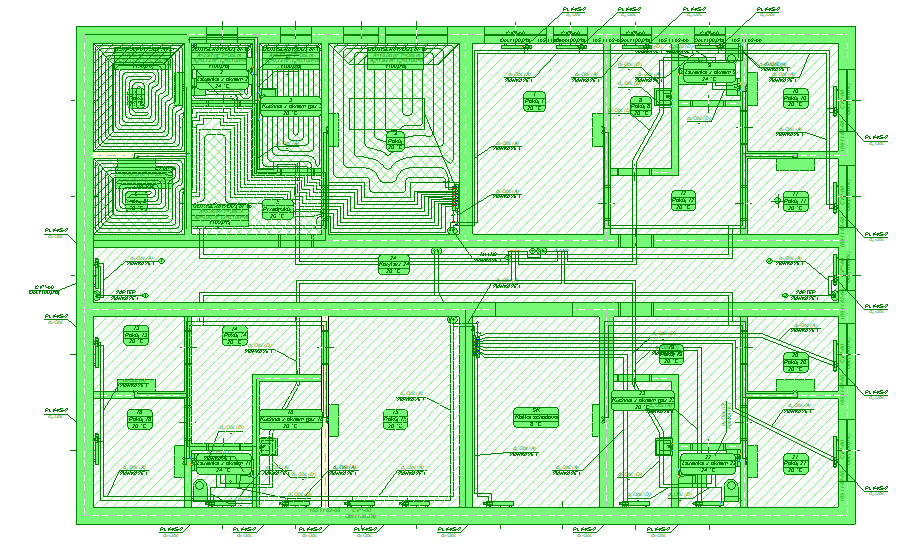
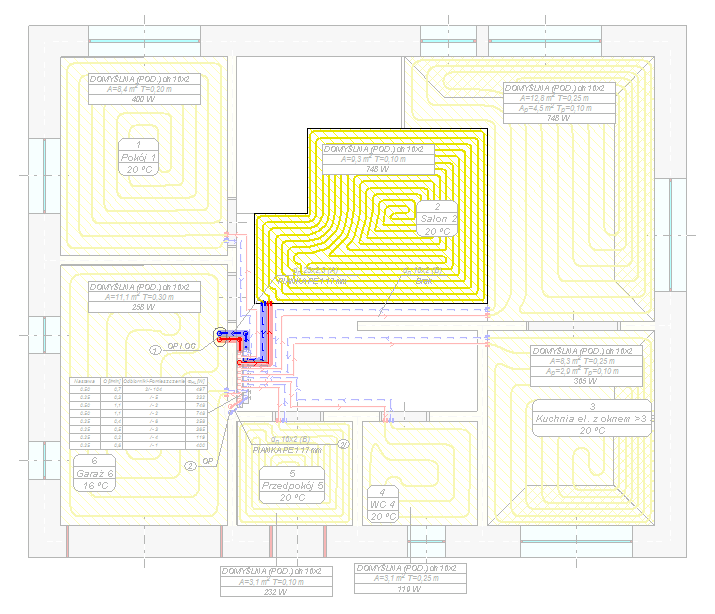
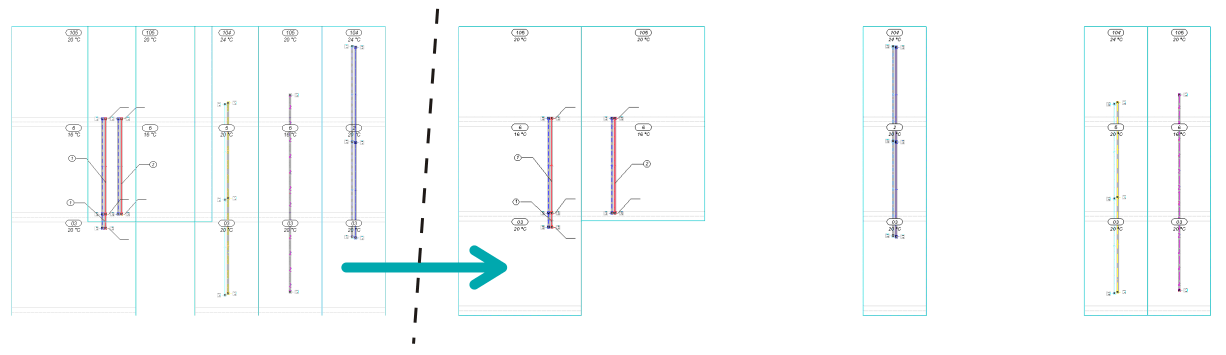
Dėl kartu su programine įranga pristatomų standartinių dalių, pvz., tipinių vertikalių arba vamzdynų sistemų dalių, brėžinių (blokų) bibliotekos galima greitai sukurti sistemos schemą. Be to, vartotojas gali nustatyti iš esmės neribotą skaičių savo blokų, kuriuos sudarytų bet kuri brėžinio dalis. Tokie blokai vėliau gali būti panaudoti vėlesniuose projektuose. Naudojant dubliavimo funkciją, sudaryta vieno aukšto schema gali būti automatiškai nukopijuota į kitus aukštus (2 pav.).
Duomenų įvedimas
Duomenys grafiškai gali būti įvesti į programą ant plano vaizdų arba ant schemų. Reikiama informacija apie nubraižytus elementus įvedama į lenteles, siejamas su plano vaizdais arba schemomis. Suvedus duomenis į lenteles, galima greitai redaguoti duomenis, susijusius su viengubais vamzdžiais, radiatoriais, montavimo elementais bei visa pasirinktų elementų grupe. Kiekvienas sistemos elementas turi patikros ir pagalbos sistemą, kuri teikia informaciją apie reikiamą įvesti parametro dydį arba atitinkamus duomenis iš katalogo.
Siekiant palengvinti duomenų įvestį, programinė įranga siūlo:
-
galimybę vienu metu redaguoti daug sistemos komponentų;
-
galimybę naudoti iš anksto paruoštus blokus;
-
išmaniąsias funkcijas, dubliuojančias bet kurią brėžinio dalį horizontaliai ir vertikaliai, kartu tinkamai prenumeruojant elementus;
-
galimybę nustatyti iš esmės neribotą skaičių pritaikytų blokų, kuriuos sudarytų bet kuri brėžinio dalis;
-
greitą prieigą prie pagalbinės informacijos apie kiekį, kurį reikia įvesti;
-
iššokantys mygtukai, palengvinantys prieigą prie dažnai naudojamų komponentų;
-
funkciją, dinamiškai sujungiančią lentelės ir brėžinio duomenis;
-
funkcijas, automatiškai sujungiančias tvirtinimo elementus, radiatorius ir kitus sistemos elementus, kuriuos sujungti būtini vamzdžiai;
-
automatinį statvamzdžių projektavimą pagal plano vaizdus;
-
galimybę redaguoti duomenis lentelėje, vienu metu nustatant kelių pasirinktų elementų parametrus;
-
dinamišką jungtį tarp brėžinio duomenų lentelės svarbiausių elementų, lentelėje redaguojamo elemento.

Data diagnostic system
-
Each inputted component is equipped with the validation and support system that allows to obtain information about the values or evokes the relevant catalogue, as well as test of data.
-
While entering data the program checks its correctness on an ongoing basis. This allows a significant reduction in the number of errors. During the calculation process, complete data validation takes place. As the result of that the list of errors, warnings and hints is created. The list includes the information about the significance levels and the place of the problems.
-
After the calculations, program analyses the obtained results. The analogue list of messages is created. Extensive system diagnostics enables the designer to fully assess the quality of the design. The program is equipped with a mechanism for quick search of where the error occurred (automatic finding a table, a row and a column with wrong data and faulty component is indicated in the drawing).
Sluoksnių kūrimas
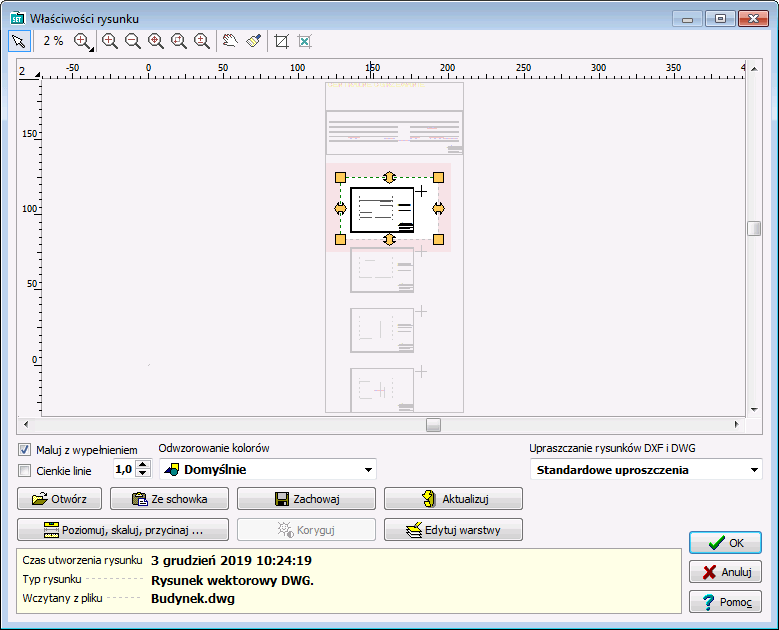
Skaičiavimų rezultatų vaizdavimo aukštų planuose galimybė leidžia sukurti pilną grafinę sistemos dokumentaciją. Dažnai po projektu reikia įkelti projekto paveikslėlį. Paveikslėlius galima įkelti importuojant paveiksliuko failą, skenuojant paveiksliuką arba įklijuojant iš kopijavimo atminties. Įkeltą paveikslėlį dažnai reikia suderinti su esamu projektu (palyginti, apkirpti, pakoreguoti ir pan.).
Techniniai brėžiniai (pvz. sluoksniai) šiais laikais beveik visuomet kuriami kompiuterių pagalba. Tuomet juos galima išsaugoti atitinkamo formato failuose. Vektoriniai failų formatai (pvz. DWG, DXF, WMF, EMF) yra dažniausiai brėžiniams naudojami ir tinkamiausi formatai. Paveikslėlių failus taip pat galima sukurti naudojantis skeneriu, tuomet dažniausiai sukuriamas rastrinio formato failas (BMP, JPG, JPEG, TIF, TIFF, GIF, ICO, PNG).
Įprastai įkeliant paveikslėlį būtina paveikslėlio įkėlimo dialogo lange įvesti atitinkamą informaciją. Įkeltą paveikslėlį dažnai reikia suderinti su esamu projektu (palyginti, apkirpti, pakoreguoti ir pan.). Galima pasirinkti skenuoto paveikslėlio raišką ir kokybę, bei išsaugoti skenuotus dokumentus pasirinktu grafiniu formatu. Programa suderinta su TWAIN skenerių specifikacijas atitinkančiais skeneriais.
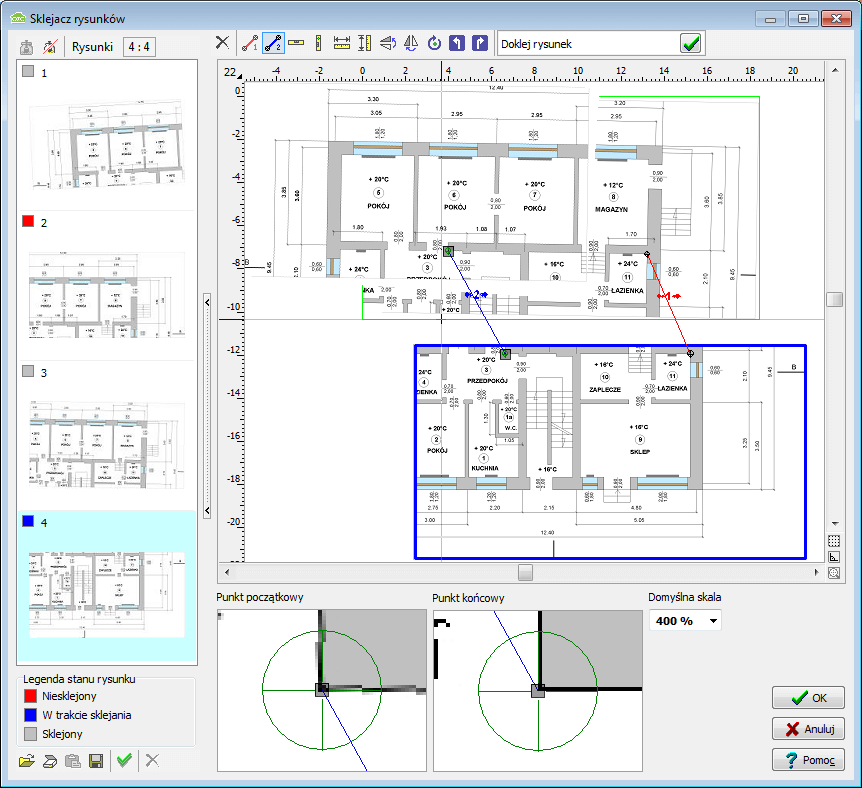
Bonding and scaling drawings
HL programs and CH are equipped with the function of Graphic creation of a building model. This function gives you the opportunity to draw a building model. To simplify the action of drawing, you can load a drawing base into the program. The file being loaded can come from an external program for creating technical drawings (eg DWG), or from a scanned drawing (eg JPG). The scanned drawing can be divided into several files. Drawings scanned into several files usually do not keep the scale precisely enough. They can also be rotated relative to each other by a small number of degrees.
Drawing bonding allows you to quickly scale multiple scanned drawings (in different sizes and rotated) and bond them with one another.
Grafinis redaktorius
Norint sukurti sistemos projektą, būtinas brėžinys su pažymėtomis patalpų zonomis. Projektuotojas gali braižyti patalpų zonas rankiniu būdu arba įkelti jas kartu su plano vaizdais iš šilumos apkrovos programos (OZC 6.5). Jei OZC 6.5 buvo sukurtas trimatis pastato modelis, plano vaizdai su šilumos apkrovos rezultatais bus importuoti į programą CH. Pastatas, įvestas į lentelę, bus įkeltas kaip patalpų sąrašas su apskaičiuotais rezultatais.
Patogiausia dirbti panaudojant visą abiejų programų, PZC 6.5 ir CH 4.0, potencialą:
-
įkeliant pastato planą iš failų, pvz., DWG, DXF, WMF ir t. t., į programą OZC 6.5;
-
programoje OZC 6.5 nubraižant trimatį pastato modelį ir atliekant šiluminius skaičiavimus;
-
perkeliant rezultatus iš programos OZC 6.5 į programą CH 4.0 (šilumos apkrovos ir aukšto plano vaizdus);
-
braižant sistemą programinėje įrangoje OZC 6.5 ir atliekant skaičiavimus.
Sistemos projektas gali būti atliekamas kaip schema, plano vaizdai arba iš dalies kaip schema, iš dalies kaip plano vaizdai.
Jei sistema braižoma kaip plano vaizdai, programa automatiškai sukuria paprastą schemą, kuri sujungia visus plano vaizdus.
Numatytųjų duomenų paveldėjimas
Didelė dalis parametrų, įvestų pastato nustatymo pradžioje, yra visam pastatui būdingi duomenys (t. y. numatytieji duomenys). Šiuos duomenis naudoja duomenų paveldėjimo sistema.
Vartotojas kiekvienos klasės įtaisui gali nustatyti numatytąjį katalogo simbolį. Simbolis automatiškai priskiriamas (paveldimas) kiekvienam įrenginiui esančiame projekte. Numatytasis katalogo simbolis gali būti bet kada pakeistas, net kai įrenginiai į brėžinį jau įtraukti. Jei simbolis pakeičiamas bendruosiuose duomenyse, simboliai pasikeičia visuose to tipo įrenginiuose, išskyrus atvejus, kai konkretus simbolis elementui įvestas atskirai. Daug kitų parametrų taip pat gali būti analogiškai paveldėta.
Duomenys redaguojami lentelėje, todėl vienu metu galima nustatyti kelių elementų parametrus. Jungtis tarp brėžinio ir lentelės brėžinyje paryškinama, matomas lentelėje redaguojamas elementas.
Duomenų paveldėjimo sistema:
-
padeda sutaupyti daug laiko įvedant duomenis (pašalinama būtinybė kelis kartus įvesti pasikartojančius duomenis);
-
gali labai greitai pakeisti pasikartojančius duomenis, jei pasikeičia projekto sąlygos arba rengiami keli projekto variantai.
Working in a shared environment Audytor SET
The program (since version 7.0) has been created as a module of the Audytor SET program and enables the simultaneous design of cooling, cold and hot water systems together with circulation and central heating installations. Individual modules of the program cooperate with each other and use a common 2D and 3D graphic environment.
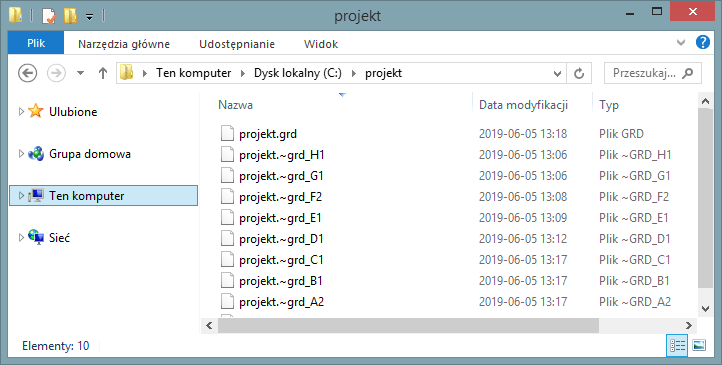
Backup system of data files
The program has a mechanism that automatically creates a set of project backups (up to 8 files).
Data files are backed up every time data is saved, with the new files overwriting the older files so that at least one copy of the file from each stage of the project work is always kept.
This function will allow you to recover the project file even if its last versions are overwritten or damaged.
Extensive directory database
The program catalog database contains information on pipes, fittings and radiators. This database is constantly developed.
In one design, fittings, pipes and radiators from different companies can be used simultaneously.

Pagalbinės braižymo funkcijos
-
Pelės žymeklis tampa atitinkama naudojamos funkcijos piktograma.
-
Rodomos pagalbinės linijos, padedančios automatiškai sujungti konkrečius charakteringus taškus (pvz., radiatoriaus jungčių taškus).
-
Vamzdžiai braižomi poromis (tiekimo / grįžtamieji), parenkant tarp jų tarpus, kurie, jei reikia, automatiškai pakoreguojami pagal prijungtus įrenginius (pvz., pagal radiatorių prijungimo taškų tarpus).
-
Jei vamzdžiai braižomi kaip daugiakampė grandinė, reikia mažiau kartų spustelėti pelę.
-
Automatinis radiatorių įterpimas po langais.
-
Automatinis radiatorių sujungimas naudojant apatinius jungimo prie vamzdžių taškus.
-
Galimybė dubliuoti bet kurias brėžinio dalis tame pačiame arba kitame aukšte.
-
Galimybė sukurti veidrodinį elementų vaizdą.
-
Galimybė naudoti iš anksto paruoštus blokus. Dėl kartu su programine įranga pristatomų standartinių dalių, pvz., statvamzdžių aukštų, buto ir vamzdyno sistemos elementų, brėžinių dalių (blokų) bibliotekos, galima greitai sukurti schemą.
-
Galimybė nustatyti iš esmės neribotą skaičių pritaikytų blokų, kuriuos sudarytų bet kuri brėžinio dalis. Iš anksto parinkti blokai vėliau gali būti panaudoti vėlesniuose projektuose.

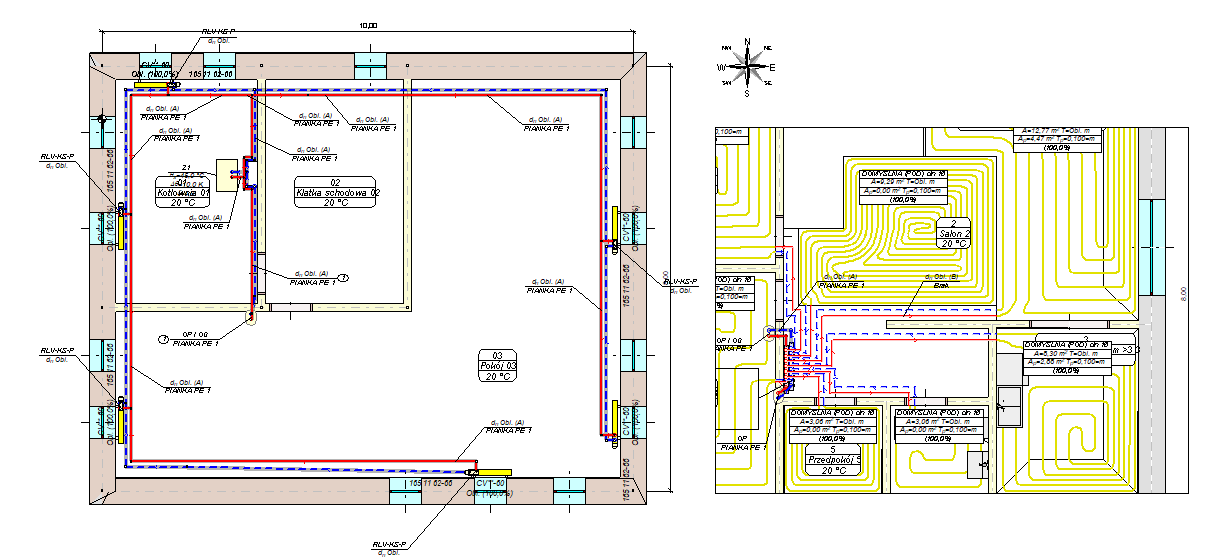
Grindinių radiatorių projektavimas
Programa turi integruotą grindinių radiatorių projektavimo modulį. Jis yra integrali centrinio šildymo įrengimo projektavimo grafinės sistemos dalis. Pirmas veiksmas projektuojant grindinį šildytuvą yra nustatyti grindų konstrukciją (3 pav.). Programos kataloguose pateikiamos populiariausios grindinio šildymo sistemos, kurias sudaro vamzdžiai, sistemos plokštės, šilumos ir drėgmės izoliacija, tvirtinimo elementai ir t. t. Projektuotojas gali kurti visą konstrukcijų komplektą, kurį galės panaudoti ir vėlesniuose darbuose. Programa atlieka skaičiavimus pagal EN 1264 standartą. Grindinis šildymas kuriamas pagal pasirinktą sistemą, drėgną ar sausą arba konkrečią grindų konstrukciją. Konkretaus pasirinkto gamintojo duomenys yra numatytieji duomenys, kuriuos galima keisti esant individualiam izoliacijos projektui.
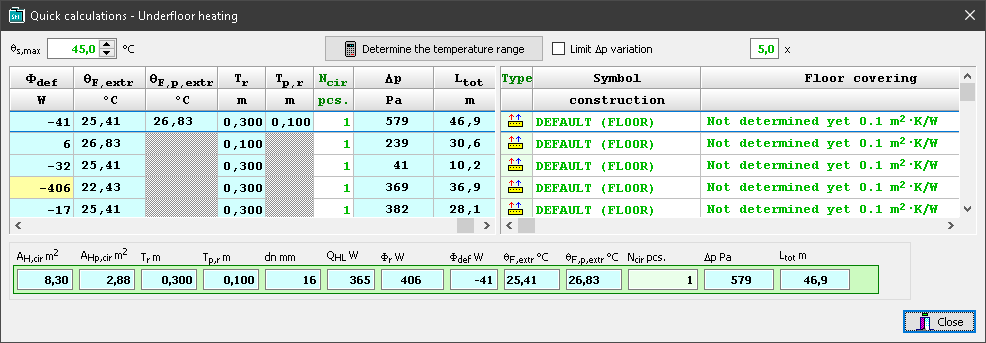
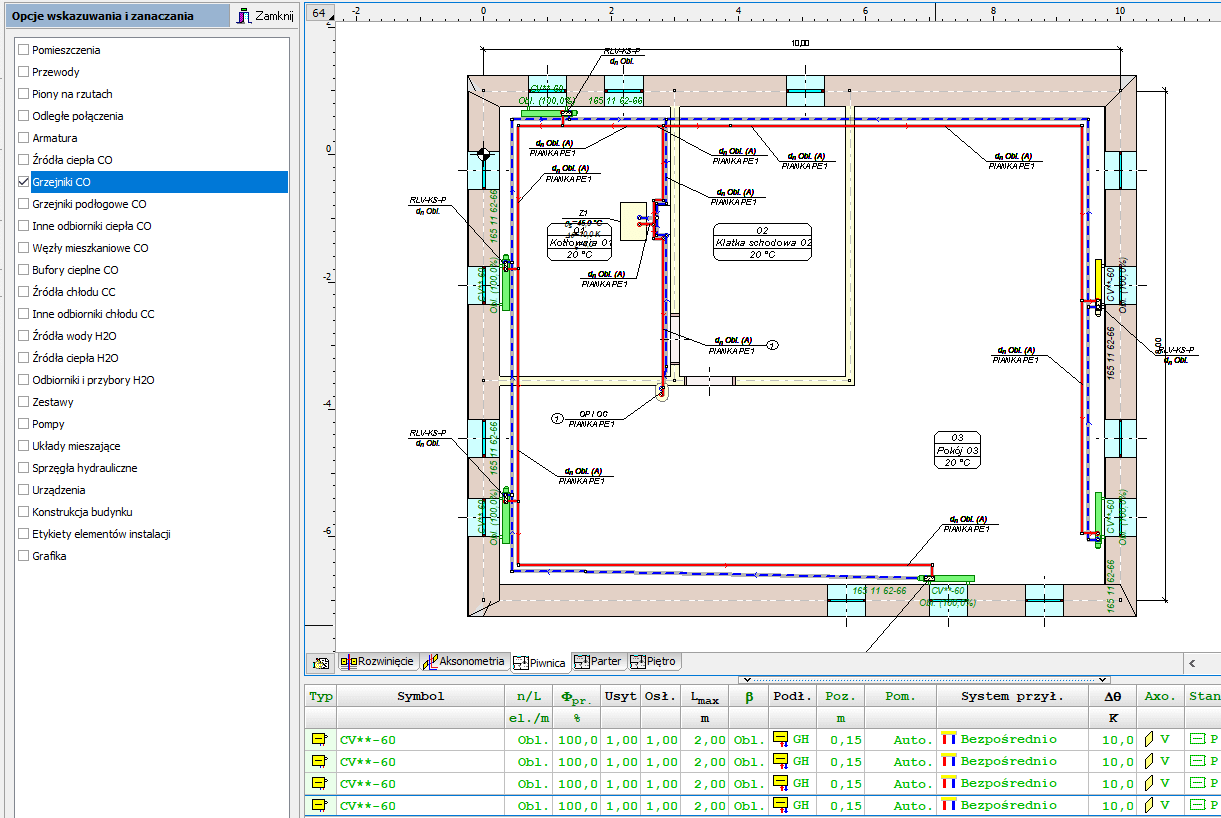
Pirminiai grindinio radiatoriaus šilumos išeigos skaičiavimai gali būti atlikti iš karto įvedus grindų konstrukciją (4 pav.). Tai sudaro sąlygas apytiksliai apskaičiuoti radiatoriaus šiluminę išeigą, grindų paviršiaus temperatūrą ir kitus parametrus. Gauti rezultatai gali būti naudingi projektuojant radiatorius atskirose patalpose.
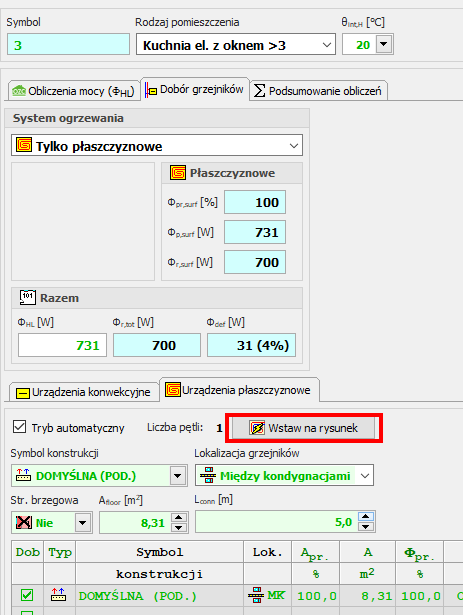
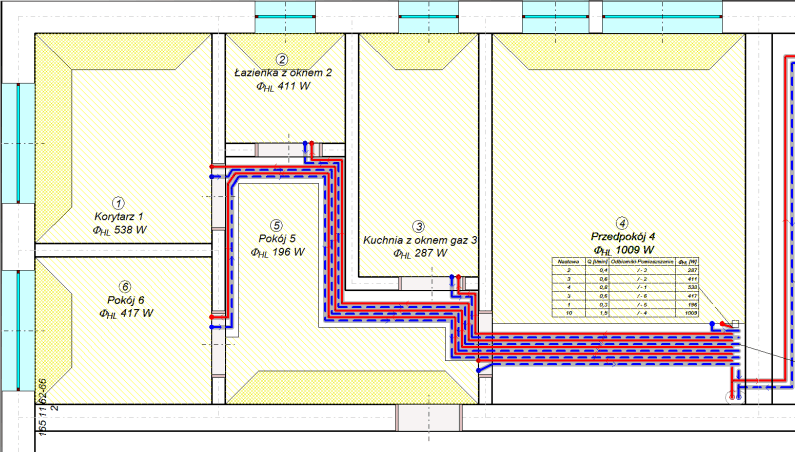
Norint įterpti grindinį radiatorių į brėžinį, pakanka pateikti informaciją apie jo tipą, patalpos šilumos apkrovos dalį ir, jei sudaroma schema, grindų plotą, skirtą radiatoriui (5 pav.). Atlikdama skaičiavimą, programa parinks tinkamus tarpus tarp vamzdžių ritėje, nustatys faktinį paviršių ir ritės ilgį.

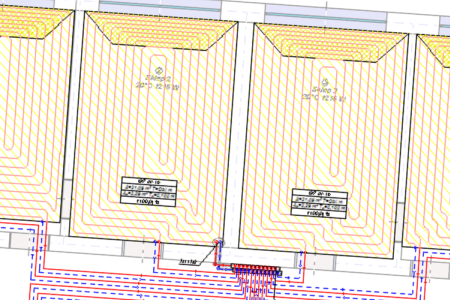
Automatic drawing of the underfloor heating coil
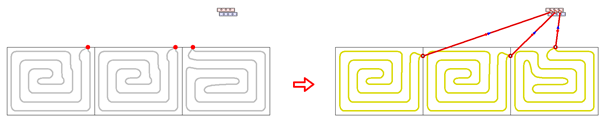
The program is equipped with the function of automatic drawing of a heating pipe routing scheme in a spiral system.
Coils are created in all floor heaters on floor plans, taking into account the spacing of supply and return pipes as well as the indicated spacing between the pipes wherever possible, both in the basic zone and in edge zones.
The program also performs precise calculations of the generated coil length.
Diagnostinė duomenų sistema
Kiekvienas įvestas komponentas turi patikros ir pagalbos sistemą, leidžiančią gauti informacijos apie vertes arba panaikinančią susijusį katalogą bei testuojančią duomenis.
Three-dimensional visualization of the installation
The function allows you to export the installation project to a file that can later be loaded into Autodesk® Revit® using the Audytor SET plugin for Revit.
The function allows you to export from the data and export from the results. Export from data allows you to save even an incomplete installation project (not recalculating), for example, the arrangement of the water risers, or the layout of the radiators. Export from results allows us to use technical data of selected pipes and devices in Autodesk® Revit®, eg pipe diameters, valve settings, radiator sizes, and pipe spacing in underfloor heating. In addition, physical quantities are available, such as the medium speed, the power of the radiator, and pressure losses.
Automatic axonometry of the installation
The program since version 7.1 has a mechanism that automatically generates the axonometric scheme of the designed installation.
Axonometry drawing can be printed or exported to DWG format, which allows to create a complete project documentation.
The axonometry schema also allows displaying the scheme of the entire installation in one drawing allowing for a more precise orientation in the project and selecting and simultaneously editing the element data on different floors, which significantly speeds up the procedure of design modification and installation adjustment.

The function of organizing zones of risers on the diagrams
In the drawing of the automatically created installation diagrams, the Organize button that has been added, enables the intelligent positioning of the zones of risers based on the data from the storey's plan views.
The program maintains the order of the risers within individual installation systems (CH, CC and H2O).
The function is particularly useful for large projects, significantly reducing the time needed to manually move the risers' zones.
The parameters of the organizing function can be modified.
Checking data and calculation results
Each inputted component is equipped with the validation and support system that allows to obtain information about the values or evokes the relevant catalogue, as well as test of data.
While entering data the program checks its correctness on an ongoing basis. This allows a significant reduction in the number of errors. During the calculation process, complete data validation takes place. As the result of that the list of errors, warnings and hints is created. The list includes the information about the significance levels and the place of the problems.
After the calculations, program analyses the obtained results. The analogue list of messages is created. Extensive system diagnostics enables the designer to fully assess the quality of the design. The program is equipped with a mechanism for quick search of where the error occurred (automatic finding a table, a row and a column with wrong data and faulty component is indicated in the drawing).
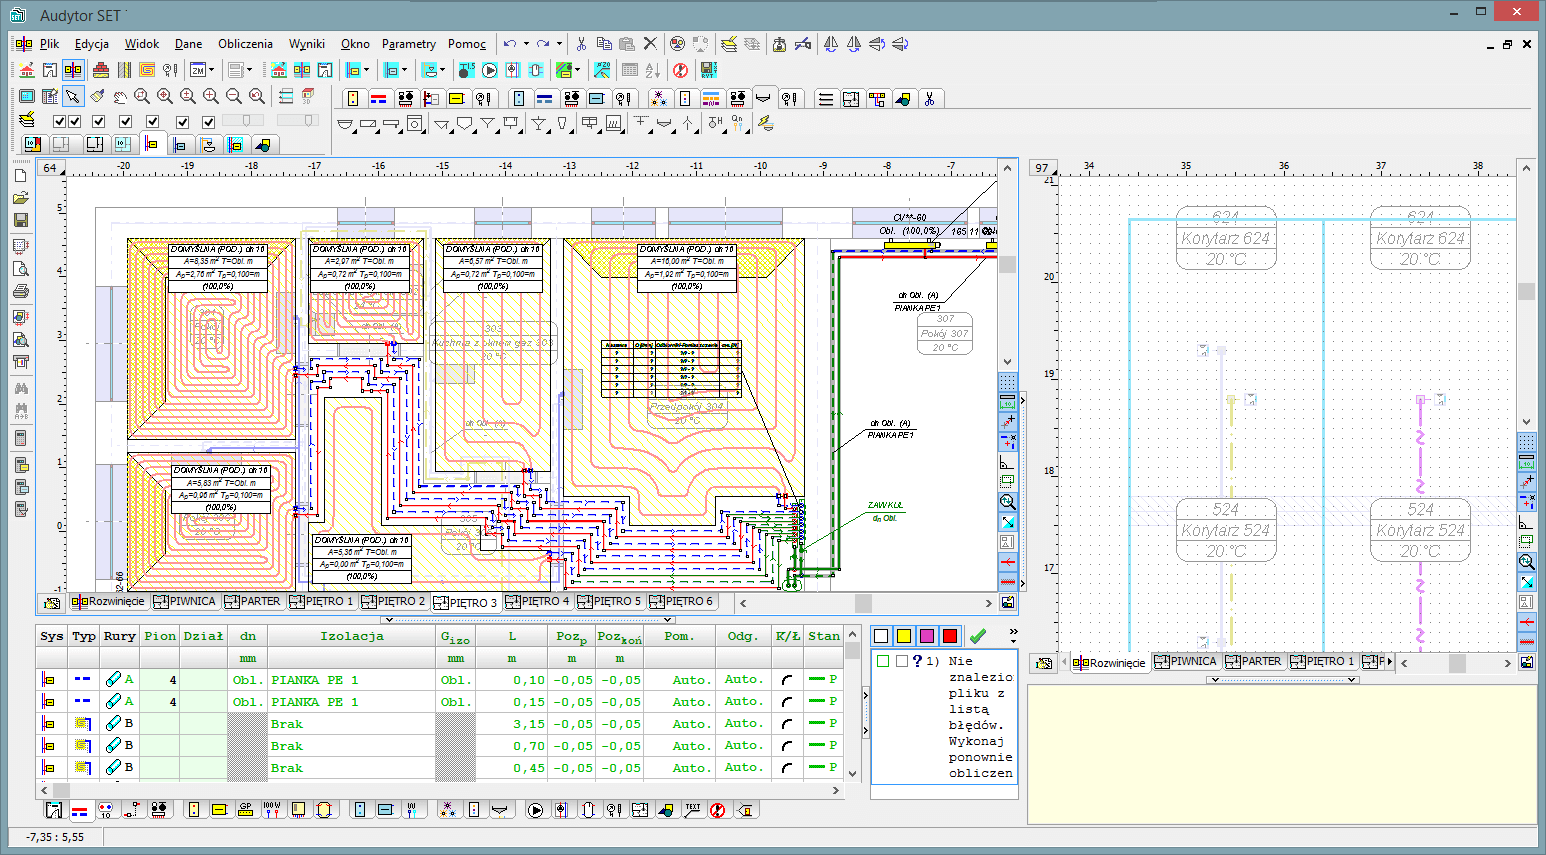
Skaičiavimų rezultatai
Skaičiavimo rezultatas pateikiamas tiek grafiškai, tiek lentelėje (7 pav.). Kiekvieno sistemos komponento formatavimo etiketės gali būti laisvai keičiamos (rodomų verčių ir etikečių stiliaus išvaizda).
Lentelių formatas (pasirinktų skilčių ir eilučių išvaizda, šrifto dydis) gali būti keičiamas ir rūšiuojamas pagal bet kokį raktą.
Lentelėse pateikiami bendri rezultatai ir išsamūs kiekvieno įrenginio, grandinės bei medžiagų ir tvirtinimo elementų sąrašo rezultatai.
Kai brėžinys pateikiamas su rezultatais, taip pat matomos ir etiketės su konkrečiais nurodyti įrenginio duomenimis. Visa etikečių forma gali būti redaguojama. Visi konkretaus elemento rezultatai gali būti pateikiami etiketėje. Galima išsaugoti daug etikečių formatų, kurie vėliau gali būti nedelsiant pakeisti.
Skaičiavimo rezultatai gali būti atspausdinti naudojant braižytuvą arba spausdintuvą. Vartotojas gali pasirinkti brėžinio mastelį ir, naudodamas spaudinio peržiūros funkciją, nustatyti, kaip brėžinys turi būti atspausdintas.
Jei brėžinys netelpa į vieno popieriaus lapą, programa atspausdina jį fragmentais, kurie vėliau gali būti suklijuoti. Todėl, naudojant netgi paprasčiausią A4 spausdintuvą, gali parengti didelius brėžinius. Programa taip pat gali išsaugoti brėžinius DXF arba DWG failuose. Tuomet išsaugoti brėžiniai gali būti įkelti į kitą programinę įrangą, pvz., „AutoCAD“.
Lentelės su skaičiavimų rezultatais gali būti atspausdintos arba išeksportuotos į kitas programas, veikiančias „Windows“ aplinkoje (pvz., skaičiuoklę, teksto redaktorių ir t. t.).
Designing a several installations in one project
The ability to design several systems in one project in order to design the entire system for the building at the same time.
Efficient and fast calculation process
Program is equipped with a highly efficient analysis algorithm of graph installations and efficient algorithms of selection of pipes, fittings and accessories, which allow to calculate large installations in in less than a few seconds.
Creating technical documentation
Designers can use the editor of labels, creating overview of materials and components of heating systems in order to prepare technical documentation of projects. Diagrams of heating systems can be divided into any number of drawings. Drawings themselves can be exported into the DWG format.
Technical requirements
The program runs under MS Windows (10, 11) 32bit and 64 bit.
The minimum hardware:
- 1200 MHz processor,
- 4 GB RAM,
- 2 GB of free hard disk space,
- A color monitor with a minimum screen resolution of 1024x768,
- 500 MB free space on the hard drive,
- Compatible graphics card with OpenGL 2.0 and higher: all new graphics cards on the market should meet the minimum hardware requirements;
Hardware requirements for the 3D editor
Vertical resolution requirements for the screen:
- minimum - 768 points,
- sufficient for comfortable work - 900 points,
- the most convenient - 1080 points.
Requirements for system font settings:
- Windows Vista, 7, 8 - fonts "100% smaller",
- Windows XP - "normal" fonts.
The computer should have a graphics card that supports OpenGL technology in the version:
- minimum 2.0,
- sufficient for comfortable work: 3.3 and higher.
Autorystės teisės © 2018 SANKOM Sp. z o.o.